.svg)

.webp)

Calculating return on investment can be a difficult task, especially when improvements are hard to track back to the original source, for example in customer experience metrics like CSAT or NPS scores.
In this short article, we've pointed to some tangible elements of impact to help kick off your ROI case.
Improving loyalty and retention
Our customers primarily use SentiSum to reduce the call volume, optimise time-consuming processes and inform product or website improvement roadmaps.
However, their long-term goal is to generally improve their customers’ experience to drive customer loyalty and retention. They expect that this will have a further positive impact on their organizations’ financial bottom lines.
Replace manual tagging
Before: Employees have to manually tag support tickets. This takes up to 15 seconds per ticket.
After: This task is completely removed by SentiSum.
Calculation: Total hours of time saved x Per hour agent salary
Example: 10,000 monthly tickets = 42 hours saved each month = $625. If you have 10,000 tickets, over one year you would save +$7,500 from replacing manual ticket tagging alone.

Input your own numbers in our spreadsheet to calculate. Find it here (Tab 1).
Simplified Reporting
Before: Because of inaccurate or high-level ticket tagging, an employee has to manually work the data to create a credible ticket tag report on a weekly or bi-weekly basis.
After: The tags are now accurate and specific issues are clearly presented. The dashboard presents them in an easy to collect way, and little to no 'data work' time is needed.
One SentiSum customer estimated that their weekly reporting went from 5 hours per week down to 15-minutes, a 20x productivity gain.
Another SentiSum customer equated their time savings on reporting to 1/2 a full-time employee each month.
Calculation: Employee Salary Per Hour x Time Saved Each Report
In the below example, simplifying reporting saved $11,000 annually in related costs.

Input your own numbers in our spreadsheet to calculate. Find it here (Tab 2).
Tackle friction points and improve customer experience
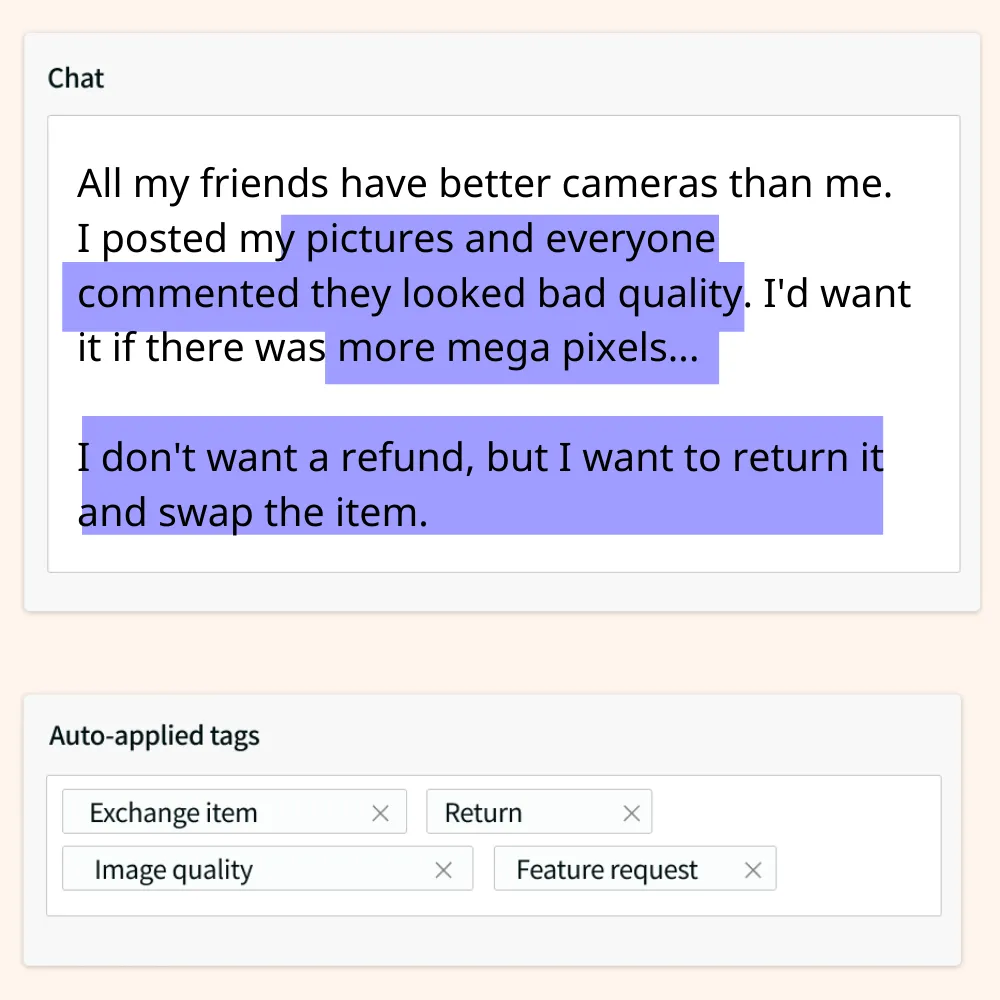
Before: Generic tags (e.g. 'refund') do not get to the root cause of the issue and leave many issues unaddressed.
It's often unclear what exactly is driving customer contact and is therefore hard to prioritise which improvement projects to choose.
It can also be hard to incite company-wide change without concrete quantitative evidence.
After: SentiSum provides customers with granular ticket tags that make root cause analysis simple. The quantitative evidence is at the customers fingertips, making it easy to take action on and tackle the drivers of ticket volume.
Example: One SentiSum customer had 20,000 support tickets per month. 3,000 of which related to the website. After implementing SentiSum, the company identified what the main issue was and where the issue was happening. Related to this issue, support ticket volume reduce by 37% (more than 1,000 tickets) thanks to more granular insight.
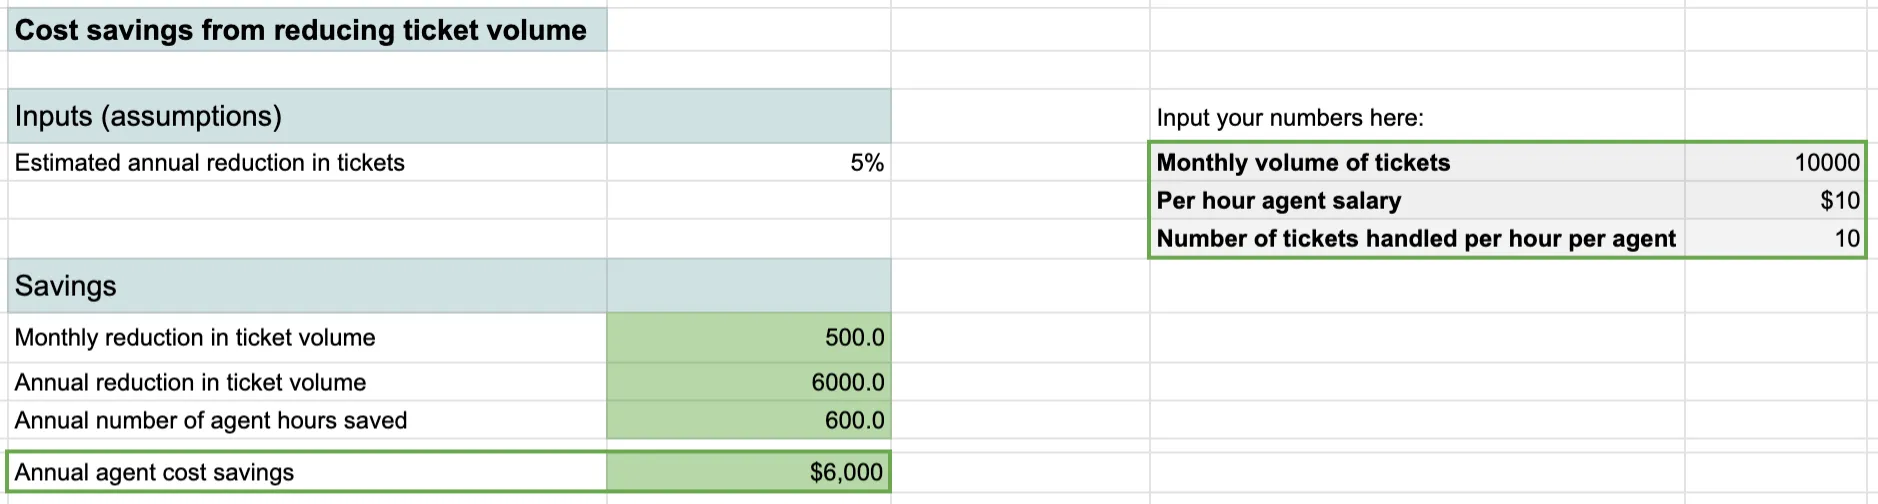
Calculation: Estimated Tickets Reduced x Overhead Costs of Tickets
In the below example, with a low estimate of 5% ticket reduction, the company saved $6,000 per year.

Input your own numbers in our spreadsheet to calculate. Find it here (Tab 3).
--
From these three elements alone, without mention of retention, loyalty and other improvements, a company with 10,000 tickets could save around $25,000 each year by implementing SentiSum.
.webp)
.jpg)


.webp)