.svg)


‘On a scale of 1 to 10, how likely is it that you would recommend this product to your friend or colleague?’
I can’t be the only person who is bored senseless with being asked this question.
This linchpin of NPS has been a staple in customer feedback surveys for a very long time. It's not the only repetitive trope in these surveys. Many other questions like it make up the common questions we see in customer feedback surveys we’re sent.
Despite the ‘by the numbers’ nature of these surveys that we all regularly see in our inbox, they are actually the primary mechanism through which customer experience teams answer a fundamental question: how can we reduce customer friction/dissatisfaction so customers come back and buy again?
Seeing as 81% of brands see customer experience as their competitive edge, it is vital that brands have a thorough answer to this question. However, in actually providing good answers to this vital question, most customer feedback surveys fail.
They fail for a host of reasons which I’ll dig into here, along with a few thoughts on how we can make them less terrible, or maybe even good!
Three Reasons Customer Feedback Surveys Currently Suck
1. Customer feedback surveys are a slog
So, let’s start from the beginning of the customer feedback survey’s journey. It’s sent to someone’s inbox, they receive it, take a look—what happens next?
Unfortunately, the most common next step will be for them to delete it without reading.
When you send a survey as a CX professional, you’re already wary of the fact that consumers today are suffering from a severe case of survey fatigue. Attention is a precious commodity in the 21st century and with surveys (especially post-COVID) being fired at consumers from all angles, we have to face the reality that most of our survey emails are going to be deleted before they are opened. There’s not a huge amount we can do to control this (...even if you do throw in a chance to win an amazon voucher).
However, when a customer does open that feedback survey email, businesses really don’t help themselves in ensuring that survey gets completed. Wow, they are a slog.
There are a lot of different ‘flavours’ of the painful slog to complete customer feedback survey: too long, the too vague, too repetitive, the 40 drop down options, etc., etc. An (un)favourite of mine is exemplified in this survey from Admiral which made countless questions asking ‘to what extent I agreed’ with the following statement. Across 3 pages there were over 30 of these style questions. The Likert Scale is a favourite in CSAT surveys and when used excessively, makes for quite a tedious survey experience.

This type of CSAT survey is a major problem for customer service and CX leaders in particular. If you want to pinpoint development areas for your customer service team or feedback to pass on to the wider business, this type of survey isn’t going to cut it on it’s own. Your customers will get bored and either quit, half read questions or most worryingly of all, just fill in randomly to end their death by survey a little quicker.
In short, you’re not getting the proper insight you need and at worst, getting actively misleading data. The fact that 96% of customers say that customer service is important in their choice of loyalty to a brand, indicates the severity of this insight gap.
That’s just one example, but I’m sure as you’re reading it you can think of a few other survey tropes that make them a real slog for customers. The great irony of all this is that the tool (feedback survey) designed to measure the quality of customer experience, often constitutes a pretty shoddy customer experience.
2. Customer feedback surveys are biased and unrepresentative
Now we move onto the second stage of the journey for our customer feedback survey: running a feedback analysis.
Even if your customer has battled through the mountain of 1-10 scale questions for the right to toss their hat in the ring for a £50 amazon voucher, that doesn’t mean they have provided you with absolute clarity on your customer’s experience and sentiment.
There are A LOT of different biases your survey could be subject to. That’s an article in itself —this piece from Delighted does a good job of breaking down the different type of survey bias, and we've covered the topic of what an actionable customer insight comprises of.
One of the biggest problems surveys have from a representation point of view goes back to the ‘slog issue’: your response rate. Trying to find a general average percentage completion figure of customer feedback surveys is obviously a bit tricky, but a figure commonly quoted for customer satisfaction surveys is 5%-30%. However, getting anywhere near 30% seems very unusual and for D2C brands, response rate is likely to be right at the bottom end of this scale, if not lower. This means that customer experience teams are making some big businesses decisions based on huge generalisations of their customer base.
On top of this is the fact that the few customers you do respond, will self-select. Those who self-select are fairly unlikely to represent a perfect cross-section of your customer base. This is known as non-response bias.
One example of how this kind of survey bias manifests itself is in ‘extreme responding’: those who respond seem to have a very strong opinion either positively or negatively. To see a clear example of this, just go on Trustpilot and search for a handful of well known consumer brands - you’ll see that the highest proportion of responses are either 5 star or 1 star, with only a tiny handful being 2 - 3 stars.

This type of bias easily transfers to customer feedback surveys in the form of NPS and CSAT 1-5 scale questions. It, therefore, creates a real insights gap for customer support teams trying to reduce contacts in particular. The majority of your customer support contacts are likely not coming from those who would rate you 5 stars! 1 star reviews certainly will have some insightful feedback for improvement but still sit on that extreme end and have very likely already churned. With this survey bias in mind, customer support and CX teams honestly have to ask themselves whether NPS surveys are truly capturing the drivers of support tickets.
There are a lot of different biases your surveys could be suffering from. But this double punch of low participation and extreme responding is pretty huge for NPS and scale based surveys (which is what most customer surveys nowadays rely on) in particular. While we all are aware of the potential for survey bias, we’ve been inclined to swallow results with a huge pinch of salt, but really we have to question whether survey results designed around these mechanisms are valid enough to draw any strong conclusions from at all.
3. Customer feedback surveys lack actionable outputs
So finally, after our survey has been completed and the results complied, actions need to be decided on. What is going to be done based on this feedback?
Even if your survey responses do represent a perfect cross section of your customers in every way (in which case, please share your secret with the rest of us), it won’t give you useful insight unless you’ve asked the right questions.
The crucial point here is that data isn’t insight. This is such an important principle which should be a no brainer, but unfortunately one we fall short on.
Let’s go back to that Admiral survey from above. Say you consistently score a 5/10 for ‘website usability.’ What do you want to do with that information? You can pass it on to the web team to review the site, but with nothing specific, what are they meant to change? Understanding that specific payment options are causing a problem, or that the checkout page keeps freezing, or that answers can’t be saved: these are all actionable insights relating to ‘website usability’. But Admiral would not have got any of that insight on this survey.
Here’s another example from my inbox. I call it the infamous ‘other’ trope. It exemplifies the difference between data and insight perfectly. The London Marathon included this survey which asked which sportswear I used. It’s listed a few options and then ‘other’. However, there was nowhere for me to specify ‘Gymshark’ in the survey. This is not an uncommon practice and yet offers absolutely no meaningful insight at all.

Then we move on to the biggest culprit: NPS. If we’re all being honest, we know that NPS has been used primarily as a vanity metric for a lot of businesses. Rather than a useful tool to identify actionable pieces of customer feedback, it has become a number companies want to check it stays steady or rises. Even this use is highly questionable when it turns out that NPS doesn’t actually correlate with retention!
With this in mind we have to ask, why is NPS the jewel in the crown of the customer feedback survey?

For the most part, the problem with the lack of actionable insight from surveys comes down to one word: granularity. The emphasis on quantitative questions with broad option answers creates surveys that lack the detail to make substantive and meaningful changes to a product or service.

Three ways to make customer feedback surveys better
So with all this in mind, how can surveys be made better? Here are 3 things to think about next time you put together and send out a customer feedback survey.
1. Prioritise Qualitative Data
This is really the most important point for improvement. As covered above, it doesn’t matter if your survey has a high response and completion rate if it’s not asking right questions. You need answers that help you make substantive improvements to your product and service.
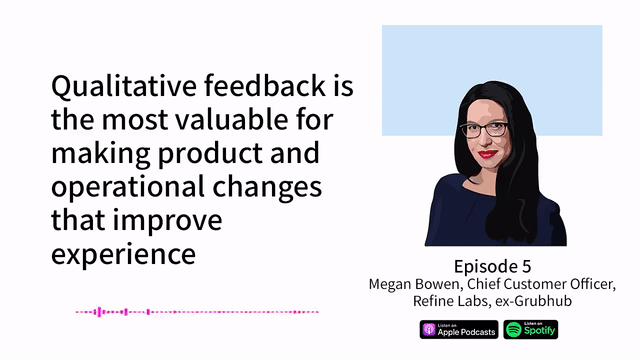
Qualitative data provides a wealth of information to do exactly this, whereas quantitative questions in surveys generally lack the detail and granularity to actually pinpoint what elements of your service need to be addressed and how. Megan Bowen at Refine Labs explains the value of qualitative data a lot better than I can. Check out this clip from the SentiSum podcast.
Now of course, this isn’t to say you shouldn’t have quantitative questions, it just means make sure you have a balance so you can get that rich, detailed feedback for making specific improvements.
Now at this point you may be thinking, ‘that’s easy to say Harry but we need to go through those thousands of qualitative responses to make sense of them’. That’s true, but there are a lot of technologies that can help you automate this process and eliminate the heavy lifting (shameless plug for SentiSum here). It’s perfectly possible to process large quantities of qualitative data at scale, and really in this day and age, it’s an absolute essential.
2. Keep them Short
You want to collect as much data and feedback as possible, I get it. But having a few, thoughtful, highly actionable areas of feedback is more important than having 50 vague data points.
Equally important is that fact that survey length has an exact correlation with completion rate according to SurveyMonkey. In the same vain, you should let your customers skip questions where possible. If they aren’t interested in answering, don’t force them. You will likely just get a random answer or a complete drop off from the survey.

An option here is to have a handful of crucial quantitative questions, and then a couple of open ended questions where customers can highlight for themselves the points that most matter. This way you avoid the problem of getting biased responses by asking highly leading questions, avoid low completion rates and allow the customer to highlight what matters most to them. Again, using text analysis systems it’s perfectly possible to process that qualitative data efficiently.
3. Don’t over-rely on them
This isn’t technically advice for how to improve a survey, but it's an important part of avoiding some of their shortcomings and biases as a voice of the customer tool.
Surveys are one channel of the customer’s voice, but you’re not going to get the crucial insight you need from them alone—low participation, non-response bias and extreme responses will always be limiting factors. Other sources of customer feedback are vital.
Increasingly, companies are turning to support data and the huge opportunities it presents for identifying customer friction. As a data source, customer support tickets avoid the myriad of bias that surveys are susceptible to as well as pinpointing most accurately (by their very nature) the most irritating and unsatisfactory elements of your experience for your customer. Customers are unlikely to be contacting support unless they have run into one of these critical friction points. Ben Goodey breaks this down thoroughly in this piece. We teach you to do a manual customer support ticket analysis in this guide.
Ultimately, just ensure that you aren’t putting all your customer insight eggs in the survey basket. The shift towards omnichannel needs to be reflected in the way we guage the voice of the customer as well.
Check out our guide to customer touchpoints for a breakdown of this.