.png)


.png)
.png)
.svg)
.svg)


Free text responses on surveys are the most honest feedback you’ll ever get from your customers.
They are raw, unfiltered feedback that sheds light on why customers left you a particular CSAT or NPS score, and what they think about your product and customer service.
But if you have thousands of survey responses, it becomes incredibly time-consuming and labor-intensive to analyze them.
This is where survey text analysis comes in.
In this article, we’ll explain what it is, two main methods to analyze text data, and how you can gather accurate, granular insights in minutes with SentiSum (our survey text analysis platform).
Jump to:
- What is survey text analysis?
- 2 methods to analyze text data
- What survey text analysis looks like on SentiSum
- 5 ways your survey text insights can drive change and improvement
What Is Survey Text Analysis, and Why Does It Matter?
Survey text analysis is the process of sorting and analyzing written survey responses to understand the feelings and opinions of customers. This involves two main techniques:
- Topic Analysis: This is where you assign topic tags or categories to text based on the underlying meaning, reason for contact, or theme. Topic analysis can go beyond the topic and subtopic of conversation to label things like intent and urgency.
- Sentiment Analysis: This is where you determine whether the survey text responses are positive, negative, or neutral. This helps you understand customers’ feelings about a product, service, or experience.
For example, for a meal-kit delivery company, it could look like this:
Topic: Quality of Meal Ingredients
Sentiment: 94% Positive
Working together, these techniques form what we call a topic-based sentiment analysis. For Customer Experience leaders, this is your holy grail of insights.
Survey text analysis helps you:
- Quantify customer issues: Customer support leaders often have a “hunch” about the main issues customers face, but they lack concrete data. Text analysis turns qualitative responses into hard data, helping leaders build evidence-based cases for change.
- Spot trends: Text analysis helps support leaders understand the top increasing and decreasing issues and the sentiment behind each. This makes it easy to track the effectiveness of past improvement projects and monitor new issues that have popped up recently.
- Answer ad-hoc questions: Product teams rely on Customer Support teams for product feedback. With the insights from text analysis, support leaders can answer product-related questions with confidence and lead improvement projects.
So, how can you go about analyzing free-text responses on your surveys?
📖 Related Read: 11 Survey Analysis Software & Tools | Free & Advanced
How to Analyze Text Data From Surveys [2 Methods]
There are two methods you can use to effectively conduct text analysis on surveys:
- Manual Survey Text Coding
- Use a Machine-Learning Based Survey Text Analysis Platform
Let’s look at each in detail.
Method #1: Manual Survey Text Coding
Text coding involves categorizing text data based on predefined codes or themes that emerge from the survey responses.
Here’s a simple text coding process you can do manually on Excel:
Step 1. Collect all the text responses in one place.
Once all the survey responses have come in, you want to export them and save them in a dedicated spreadsheet.
You can also include any extra information that might help you analyze later on (e.g. where did the feedback come from? Who is the customer? How much is their monthly spend with you?)
You’ll want to collect the same data on each piece of feedback to have a complete dataset and a meaningful result ultimately.
Here’s an example template with columns for additional customer data:

You can download this manual text coding template here.
Step 2. Categorize survey text responses.
Next, think about how you’re going to categorize the data.
We suggest you keep two spreadsheets—one for the survey responses you’ve already collated, and another to store the categories, themes, and sentiments with which you’ll code the feedback.
For instance, we used a feedback dataset, CSAT survey results, and decided to categorize the text responses into four tags: ‘delivery issues’, ‘payment issues’, ‘refund issues’, and ‘packaging issues’.
For help choosing yours, read our guide to building a tagging taxonomy here.

Then, go through each text response and:
- Manually categorize them into the tags that you’ve defined.
- Assign sentiment scores to each (1 being Happy and 5 being Angry)
Step 3. Visualize results.
Once you’ve assigned categories for all the survey responses, you want to visualize trends and patterns.
You can use a wide variety of data visualization tools out there, or you can do it on Excel, like so:

If you’d like more examples of how to visualize survey results, check out this article: 4 Engaging Ways to Present a Survey Analysis Report (With Samples)
Text coding can be a comprehensive approach if you have the time and manpower to manually read and tag every survey response.
However, it’s not ideal for larger datasets since it’s extremely time-consuming and is prone to human oversights.
It also requires a level of technical expertise and specific training in data analysis, making it less accessible for the average business user.
Method #2: Use a Machine-learning Based Survey Text Analysis Platform

A much faster and accurate method is to use a survey text analysis platform. These tools use natural language processing (NLP) to understand and categorize text data automatically.
But out of all the NLP models, we recommend choosing a platform that uses machine-learning based NLP.
Machine-learning NLP reads text (much like a human would) and labels it with a predetermined taxonomy. This includes:
- Topic
- Sentiment
- Intent
- Urgency
What’s more, after digesting a dataset being trained in machine-learning NLP, it uses statistical inference to carry that knowledge into new environments it has never seen before.
For example, it can identify and infer the meaning of misspellings, omitted words, and new words like slang by itself.
Thanks to the ML, it learns the patterns between phrases and sentences and constantly optimizes itself to improve accuracy over time.
For instance, for a survey response like:
“I love how nutritious all the meals are! Although I had an issue with payment on the website. Delivery was fast too, I got it the next day!”
Machine-learning based NLP would label it as:
- Topic 1: “Meal Quality”, Sentiment: Positive
- Topic 2: “Payment Issue”, Sentiment: Negative
- Topic 3: “Next-day Delivery”, Sentiment: Positive
This means you get a much more granular and accurate look of your customers and areas of improvement in your product.
This is why we built our own survey analysis platform, SentiSum, using machine-learning based NLP.
Let’s look at how you can use SentiSum to analyze your text data at scale.
📖 Related read: How to Conduct Sentiment Analysis Reviews [2 Methods]
What Survey Text Analysis Looks Like on SentiSum
SentiSum's advanced survey text analysis tool transforms raw customer feedback into actionable insights.
This helps you uncover impactful data on customer preferences and pain points that can’t be manually achieved at scale.
Let’s look at how it works in real-life using a meal kit delivery company’s CSAT surveys as an example.
1. Compile and Analyze Text Data From All Surveys and Channels
If you have 1000s of survey responses and other text data (emails, chats, reviews, etc.) manually gathering them into one place is time-consuming (and often frustrating).
On SentiSum, you can pull data from any channel you’d like in one click. Just authenticate the connection, and your data will automatically flow in for further analysis.
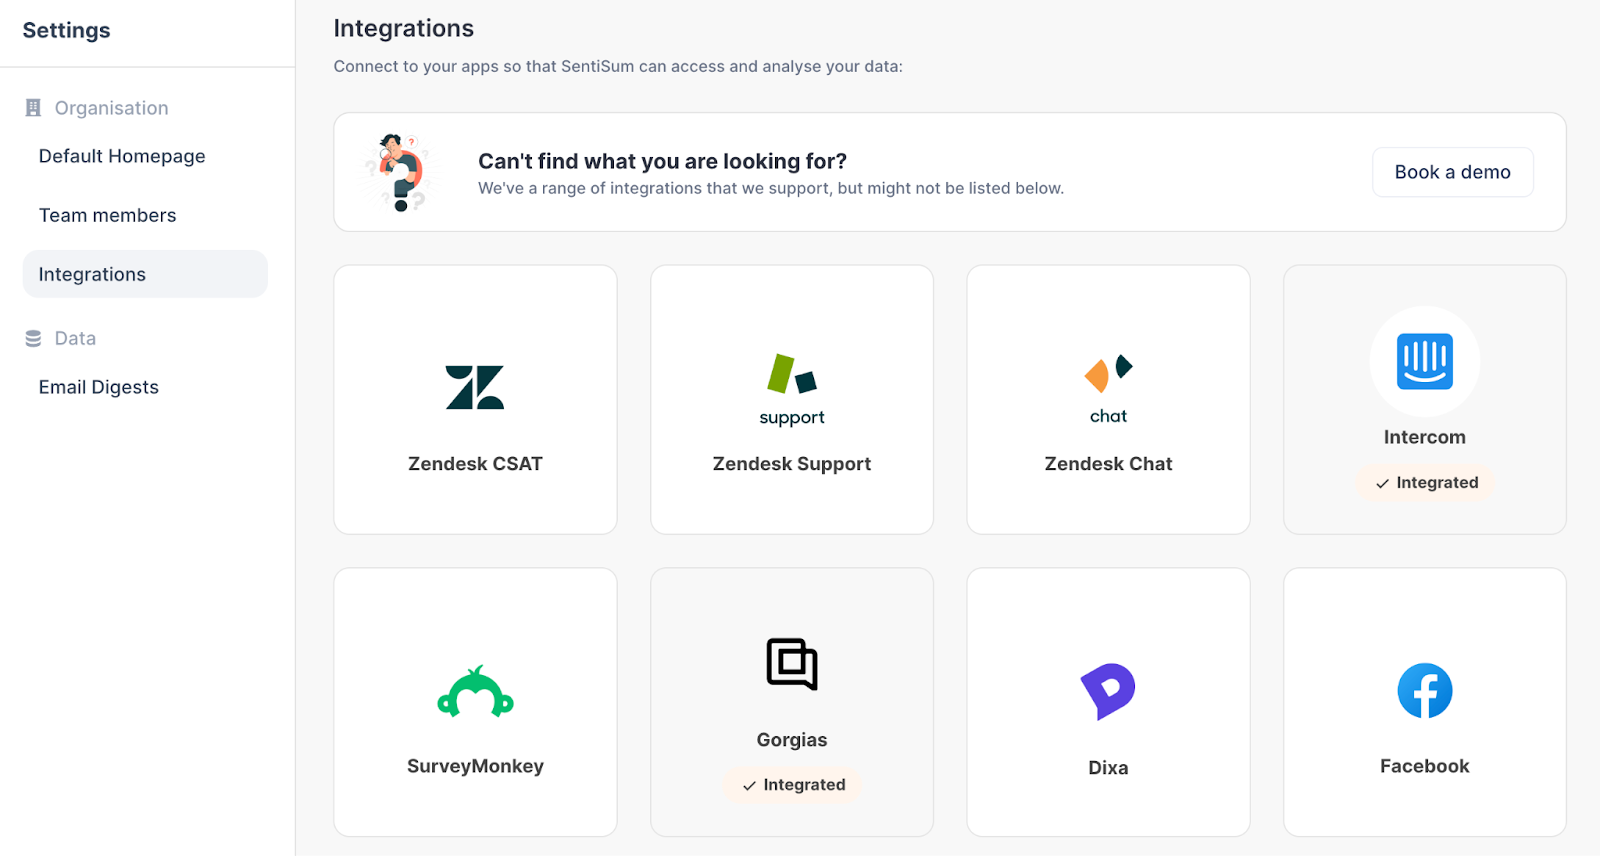
Instead of wasting time on manual data collection, you can now focus on higher-priority tasks that improve the customer experience.
2. AI Automatically Labels and Analyzes Survey Text Data
Manual tagging is prone to human oversights and bias, leaving you with an incomplete or skewed understanding of your customers.
But with a survey text analysis tool like SentiSum, you get consistent and accurate tagging thanks to machine-learning and NLP.
As Kirsty Pinner, Chief Product Officer at SentiSum, explains, "AI can cut through the subjectivity of human opinion.”
“No matter how something is said, it can report on the customer issue in a simple way,” Pinner said. “The latest developments in AI analytics can handle complexity extremely well."
With SentiSum, leaders get immediate insights while removing human biases in data interpretation.
"No other method gives a representation of customer conversations this accurately,” added Pinner.
3. Understand Each Topic Better to Prioritize Fixes
So, you’ve identified the key topics and sentiment of each survey text response. Now, what?
The next step is to fix issues that are driving negative sentiment.
Without a survey text analysis platform, these issues are incredibly hard to nail down, as you’d need to read through all the text responses. This would also take you a long time, and by the end of it, your insighs are obsolete.
But on SentiSum, you’ll be able to see the key negative sentiment drivers right on the main dashboard, like so:

To learn more about why a topic is driving negative sentiment, you can just click on that specific topic (e.g. Missing Ingredient).
SentiSum will show you every survey text response that mentions this issue, so you can understand why customers are unhappy about it in granular detail.


When you know what truly matters to your customers and why, you can make more informed decisions that target real issues and improve customer satisfaction.
4. Save Time and Answer Ad-Hoc Questions Fast with AI Summaries
Manually reading each survey response is inefficient and impractical, especially when your team expects quick answers to make important decisions.
SentiSum’s Dig In, a ChatGPT-like generative AI feature, provides succinct, summarized answers about your customer survey responses.
For instance, in the same example above on “Missing Ingredients”, you can quickly find out the root reason why customers are reaching out to you about this using Dig In.

You can then use this summary to answer ad-hoc questions from other teams quickly and confidently. You can also give them access to SentiSum so they can explore customer insights on their own.
This accelerates product development plans or any other improvement projects, which in turn improves customer experience and boosts revenue.
Try SentiSum today!

5 Ways Your Survey Text Analysis Can Drive Change & Improvement
Survey text analysis can transform raw data into insights you can act on to make significant improvements across your business.
Here are five ways a survey text analysis platform can enhance customer experiences and boost your overall business performance.
1. Closely Track Topic and Sentiment Trends Over Time
Survey text analysis software can answer important questions from customer support leaders, such as:
- "Have new issues popped up this month we’ve never had before?"
- "Did our project to fix that issue reduce the volume of customers facing the issue?"
- “What do our customers love most about this particular product?”
Customer support leaders can leverage SentiSum to quickly identify emerging trends or recurring problems and address them before they escalate into a bigger issue.
Additionally, the software’s detailed trend analysis can help confirm whether past solutions you’ve implemented have successfully decreased customer complaints about a problem.
With an eye on customer sentiment and topical trends over time, you and your team can make informed decisions to enhance customer satisfaction and loyalty.
2. Find Out Exactly Which Product Feature You Should Improve Upon
SentiSum's advanced AI creates granular, custom tags to inform customer support leaders about customer feedback regarding product features.
The technology provides an objective view of the data so you can pinpoint issues and address the most critical concerns first.
Scandinavian Biolabs, a company that utilized insights from SentiSum, was able to transform its approach to product development with the software.
"Insights from SentiSum started becoming the basis for our strategic and product meetings, giving us a sounding board for understanding our customers and their needs outside of customer surveys,” said Anders Reckendorff, CEO of Scandinavian Biolabs.
Empowered by the data-driven insights, the team at Scandinavian Biolabs accelerated the development of a new customer platform.
This platform effectively addressed a significant friction point in their customers’ journeys that had been highlighted repeatedly through support tickets.
3. Cultivate Loyalty
It’s just as important to understand what drives positive sentiment as it is to mitigate the negative.
SentiSum’s survey text analysis allows customer support leaders to discern exactly which features or experiences customers love most.
You can then showcase these elements across your marketing channels and website to reinforce the positive perceptions of your brand.
SentiSum even helps your business identify customers who experience high levels of satisfaction.
With this insight, you can engage customers further by encouraging them to share their positive experiences in reviews or testimonials.
4. Save Significant Analysis and Reporting Time
Anyone in your organization, regardless of their technical expertise, can quickly grasp essential customer insights with SentiSum.
Logging in to the software is all it takes to gain a real-time understanding of CSAT survey results and customer sentiment.
Designed for ease of use, SentiSum allows users to generate beautiful, comprehensive reports in seconds.
The reports on SentiSum’s platform can be tailored to highlight key metrics and insights that matter most to you.
For an idea of what these reports look like and how your business can incorporate them, you can view examples of SentiSum's reporting capabilities here.
5. Run a Simpler and More Complete QA
Quality assurance (QA) ensures that each of your customers’ interactions align with the high standards expected by both your business and customers.
But it's hard to coach your customer support agents when most CSAT survey results have no explanation attached to them.
SentiSum ties survey responses to other conversations you’ve had with each customer on other channels (e.g. emails, chats, phone calls, and more).
This gives you the full context behind why a customer gave you a low (or a high) score, even when they didn’t leave a comment.

This means customer support leaders can now focus less on piecing together data and dedicate more time to what truly matters: coaching and empowering their teams to deliver great experiences.
Final Thoughts on Survey Text Analysis
- Survey text analysis transforms raw data into actionable insights.
- SentiSum automates and simplifies this process, providing deep insights quickly.
- Enhance your customer understanding and operational efficiency with SentiSum.